How to compare the performance of different countries over a period of time? What are some good financial and economic metrics? Where do I find them ? Is it free and easy ?
A few of us in our private whatsapp group discuss politics quite passionately. This blog is inspired by those discussions. I used the start date of May 26 2014 as a reference to do an even comparison of different countries across multiple metrics - and summarized the stock market performance.
If you want to know the significance of the date, get quickly to the bottom of this blog titled - Results ! For those who are patient with the journey, you will have access to cool data visualization and data sets that are publicly available to draw your own inferences.
1) Stock market performance
Yahoo still runs one of the best finance websites. Chart specifically allows you to monitor performance over a custom date range. Here is the performance of the major stock indices. Which country gave a 51% increase in just about 4 years ? Check out below. Investing.com is another good source for historical data

2) Currency Comparison
Fxtop has historical exchange rate comparisons over a custom date range. Some major currencies listed below. When you invest cross border, go beyond the absolute performance of the asset. Take into account how foreign exchange eats into or aids in your investment performance.
You must have seen a lot of media coverage for Indian Rupee hovering in the 70s against the USD. Any guesses on which other OECD country didn't fare as well as the INR ?

3) Macro Economic data
I found the Google Public Data Explorer very useful.
Google has hundreds of public datasets. I specifically like the World Development Indicators dataset provided by Worldbank. This has very good cross-country comparison across Economic policy, Labor data, Health, Infrastructure and many more.
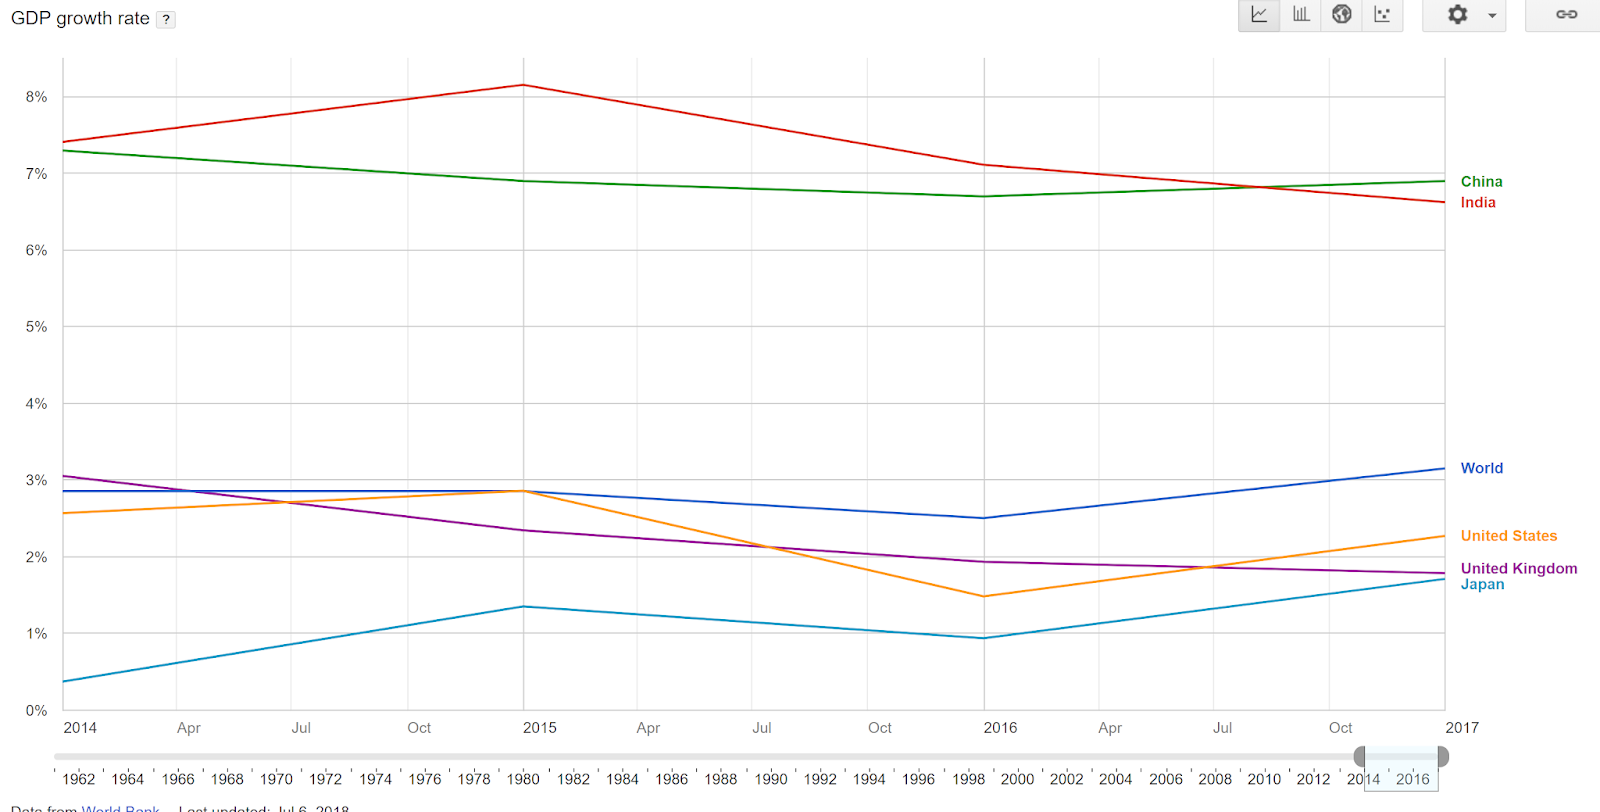
For instance: Real GDP (adjusted for inflation) for specific countries over a defined period. Not surprised at the emerging economies flying high !
You can also use the link functionality on the top right to share it like this, where I compare consumer price index across multiple countries.
Another equally powerful site is tradingeconomics.com . It has a lot of economic data all in one place and can be exported via API. But, I couldn't find charting functionality across countries. Here is another example of comparing historical inflation rates. Check out how Inflation rate is going down in India from the high of 12.17% in Nov 2013 to hovering around 4% range in 2018.

But, I love their calendar functionality below. It is a good stop to look at your daily economic calendar But, I digress !

Another source to find Inflation over a custom period for certain countries is StatBureau.
Could find all the countries I am tracking for this article except China.
Results
If you have come all the way here .. you probably are looking for the significance of this date.
It is the day on which Modi was sworn in as the Prime Minister of India. Not that, a country's performance is tied so specifically to a particular date. But, you can decide for yourself on how a country performed relative to other countries - all during a common time frame, using the tools described above on this blog.
India, Japan and US were the top 3 on different metrics. China, UK and the Europe were consistently on 4th, 5th, and 6th across all metrics.
1) India did the best in absolute market returns (10.25% annualized). However, an equally high cumulative inflation (18.6%) knocks the real rate of return to a 3rd rank at 5.9% annualized - slightly ahead of China, and clearly ahead of UK and Europe.
2) Japan did the best (9.15% annualized) on real return due to low-inflation. However, since the currency also depreciated against the dollar, it only yielded (5.98% annualized) for the cross-border US investor.
3) For the US based investor, US market was the best at (7.87% annualized real rate of return)
If you want to understand the math behind the calculations, check out my post - How did I do on my investment ?

PS: If you are interested in additional insights using the Google Data explorer, check out for insights on Trade and Wars.
No comments:
Post a Comment