How did my investment perform ? What information do I need to calculate my performance? How do I calculate my real rate of return? How to calculate returns for investment made in a different country?
This blog is inspired by several discussions over the years where first-generation immigrants generally struggle in comparing their investments across two different countries. Hopefully, you will find this useful. I am not a certified financial planner. This is not meant to be taken as an investment advice.
Let us consider the case of two siblings - Inderjit and Uma. Both were born and brought up in India.
Mr. Inderjit Narayanan Dikshitar (Mr. Ind) continued to live in India. He only invests in Indian investments.
His sister, Ms. Uma moved to the US, married Mr. Sheldon and has been living in US for the last 30 years. Ms. Uma Sheldon (Ms. US) invests primarily in the US. However, she has also made investments in India.
Let's compare three investments across these two siblings.
I1) Mr. Ind invests in in the Indian stock market on May 26 2014.
I2) Ms.US also invests in the Indian stock market on the same date. The main difference being Ms.US converted her US Dollars (USD) to Indian Rupee (INR) on that day.
I3) Ms. US also invested in the US stock market on the same date.
So, the two questions we will be asking are
Q1) Who did better: Mr. Ind on his Indian investment or Ms. US on her US investment ? and by how much ?
Q2) Which investment was better for Ms. US: her Indian investment or her US investment ? and by how much ?
In this article
- Mr. Ind and Ms.US refer to the individual persons
- INR and USD refer to the actual currency
- India and USA refer to the country names
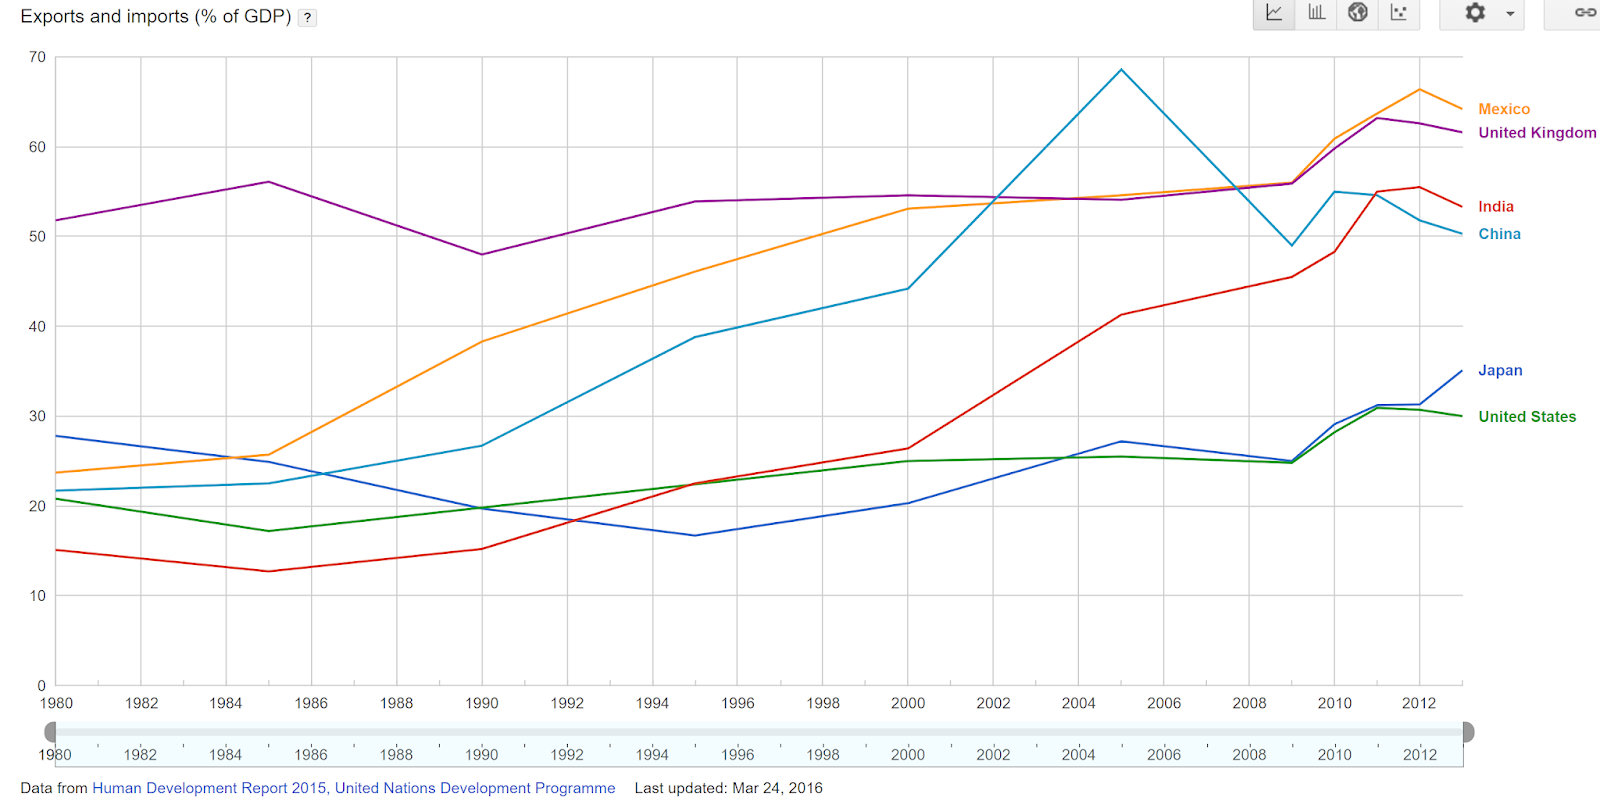
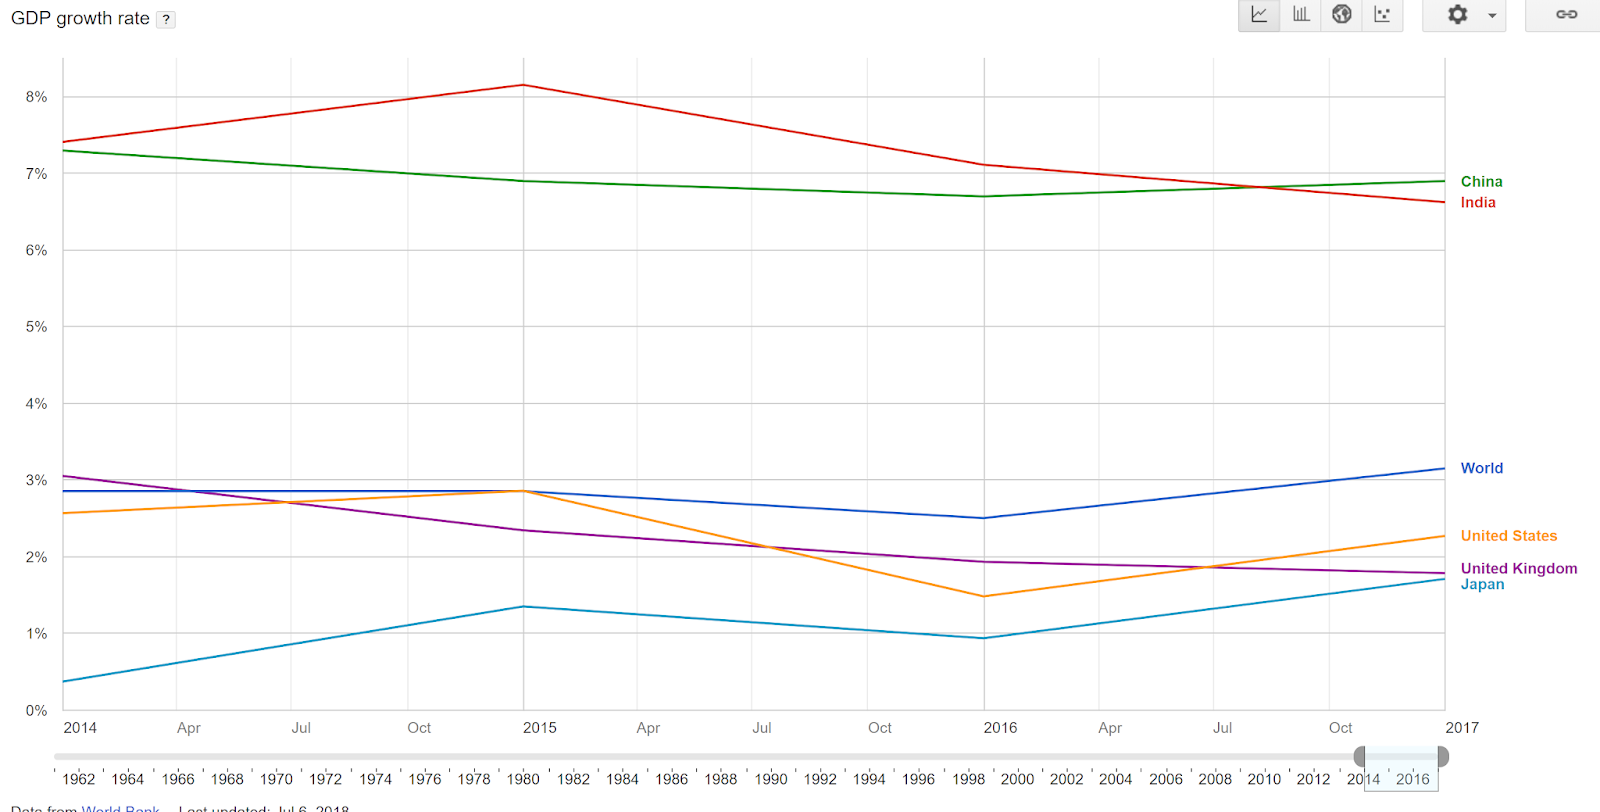
For this example, I will be using the data from the table at the end of the previous post titled - How is my country doing? Summarized below for India and USA. If you need to understand how to get that data, please read the previous post.
All these values were pulled on 8/23/18. Excel gives a formula to calculate the number of years in between the start date of May 28, 2014 and end date of Aug 23 2018. Using YEARFRAC(start, end) - the duration for these investments is 4.24 years

Let's answer the two questions on these three investments using the following four formulae.
Formula 1) Rate of Return (Nominal Rate of return)
This is the easiest to start with. Expressing gain or loss over a particular period as a %age of original value.
(current value - original value)
------------------------------------- * 100
original value
If you have another investment, you can use the above formula to calculate your personal returns. Needless to say, use the current and original value in the same local currency. For cross-border investments, do not take into account the currency fluctuations yet.
For example, if your asset increased in value from INR 120 to INR 300 over a period, the gain is (300-120)*100/120 = 150%.
This rate of return is also called the Nominal rate of return. Think of this as the returns on paper.
In our case, the USA stock market increased by 45.69% and India market increased by 51.19% over the same period. (Ref: table above)
So, based on this data alone - let us try answering the questions
Q1) Who did better ? Mr. Ind seemed to have done better on his Indian investment (I1=51.19%) compared to Ms. US on her US investment (I3=45.69%)
Q2) Which investment was better for Ms. US ? Unable to conclude since we don't have currency information at this stage.
This blog is inspired by several discussions over the years where first-generation immigrants generally struggle in comparing their investments across two different countries. Hopefully, you will find this useful. I am not a certified financial planner. This is not meant to be taken as an investment advice.
Let us consider the case of two siblings - Inderjit and Uma. Both were born and brought up in India.
Mr. Inderjit Narayanan Dikshitar (Mr. Ind) continued to live in India. He only invests in Indian investments.
His sister, Ms. Uma moved to the US, married Mr. Sheldon and has been living in US for the last 30 years. Ms. Uma Sheldon (Ms. US) invests primarily in the US. However, she has also made investments in India.
Let's compare three investments across these two siblings.
I1) Mr. Ind invests in in the Indian stock market on May 26 2014.
I2) Ms.US also invests in the Indian stock market on the same date. The main difference being Ms.US converted her US Dollars (USD) to Indian Rupee (INR) on that day.
I3) Ms. US also invested in the US stock market on the same date.
So, the two questions we will be asking are
Q1) Who did better: Mr. Ind on his Indian investment or Ms. US on her US investment ? and by how much ?
Q2) Which investment was better for Ms. US: her Indian investment or her US investment ? and by how much ?
In this article
- Mr. Ind and Ms.US refer to the individual persons
- INR and USD refer to the actual currency
- India and USA refer to the country names
All these values were pulled on 8/23/18. Excel gives a formula to calculate the number of years in between the start date of May 28, 2014 and end date of Aug 23 2018. Using YEARFRAC(start, end) - the duration for these investments is 4.24 years

Let's answer the two questions on these three investments using the following four formulae.
Formula 1) Rate of Return (Nominal Rate of return)
This is the easiest to start with. Expressing gain or loss over a particular period as a %age of original value.
(current value - original value)
------------------------------------- * 100
original value
If you have another investment, you can use the above formula to calculate your personal returns. Needless to say, use the current and original value in the same local currency. For cross-border investments, do not take into account the currency fluctuations yet.
For example, if your asset increased in value from INR 120 to INR 300 over a period, the gain is (300-120)*100/120 = 150%.
This rate of return is also called the Nominal rate of return. Think of this as the returns on paper.
In our case, the USA stock market increased by 45.69% and India market increased by 51.19% over the same period. (Ref: table above)
So, based on this data alone - let us try answering the questions
Q1) Who did better ? Mr. Ind seemed to have done better on his Indian investment (I1=51.19%) compared to Ms. US on her US investment (I3=45.69%)
Q2) Which investment was better for Ms. US ? Unable to conclude since we don't have currency information at this stage.
Formula 2) Currency Conversions
Let's try answering that 2nd question for Ms. US now.
During that time the Indian currency depreciated from the 58s to about 70 - a 16.25% depreciation per the table above.
Let's try answering that 2nd question for Ms. US now.
During that time the Indian currency depreciated from the 58s to about 70 - a 16.25% depreciation per the table above.
If Ms.US were to sell her Indian investment and bring it back into USD today, here is the formula to calculate her rate of return, taking into account the currency conversion.
[(1+nominal rate) * (1+currency appreciation rate) ] - 1
Using 51.19% for the Indian stock market return from the original, and a negative value for 16.25% for currency depreciation , her personal rate of return on the Indian investment is
[(1+0.5119) (1-0.1625)] - 1 = 26.62%
So, based on this data - let us try answering the 2nd question.
Q2) Which investment was better for Ms. US ? Her USA investment (I3 = 45.69% - no change to this one) did better than her Indian investment (I2 = 26.62% calculated in this section)
PS: Sometimes, you are able to combine the two formulae 1 and 2 above when you have absolute values for your exchange rates, as described in this post.
Formula 3) Inflation-adjusted rate of return (Real rate of return)
While the investments may have certainly increased , the underlying currencies (both USD and INR) are not as worth now as it was before. A $100 that was worth in 2014 will get you fewer goods in 2018. Similarly, 100 Rupees in 2014 will also get you fewer goods in 2018. This is captured using their respective inflation rates in their countries.
From the table above, the cumulative inflation for that period in US was 5.68% while in India it was 18.6%. So, let's calculate the inflation-adjusted rate using the formula
From the table above, the cumulative inflation for that period in US was 5.68% while in India it was 18.6%. So, let's calculate the inflation-adjusted rate using the formula
(1+nominal rate)
Real rate of return = -------------------- - 1
(1+inflation rate)
For the three investments, here are the returns
I1) Mr.Ind on his Indian investment - use 51.19% for nominal rate and 18.6% for inflation rate
His inflation adjusted return is 27.48%
I2) Ms. US on her Indian investment - use the currency-converted 26.62% calculated in Formula 2 section above for nominal rate and 5.68% for USA Inflation rate.
The reason why we use USA inflation rate of 5.68% is - she intends to spend this money in the US. She had a choice to invest in US vs. India. So, just like her US investment, the inflation rate is also US.
Her inflation adjusted return on Indian investment is 19.82%
I3) Ms. US on her US investment - use 45.69% for nominal rate and 5.68% for USA inflation rate
Her inflation adjusted return is 37.86%
Now, let us try answering the questions, adjusted for inflation.
Q1) Who did better ? The roles are reversed from the conclusion in Formula 1. Ms. US did better on her US investment (I3 = 37.86%) compared to Mr. Ind on his Indian investment (I1=27.48%)
Q2) Which investment was better for Ms. US ? Her US investment (I3=37.86%) did better than her Indian investment (I2=19.82%)
By how much ? It is too tempting to do (37.86 - 19.82) for Q2 and (37.86-27.48) for Q1 to answer the question by how much.
You would not be wrong in this case because all the investments (I1, I2, I3) were purchased and sold on the same date (by design to keep it simple)
Formula 4) Annualized return
If these investments were done on different dates and held for different duration, you wouldn't be concluding correctly. And, that is where the final formula comes into picture.
With an annualized return, you are comparing apples and oranges by bringing them under a common umbrella. The question that annualized return answers is : What is that "hypothetical annual rate of return" over "a same period" that would produce these respective cumulative returns for 3 different investments I1, I2 and I3 over "different periods" ? Here is another good article on this topic at the Motley Fool.
The math behind is:
(1+ annualized return) ^ n = 1 + Cumulative return
where n is number of years over which the cumulative return was calculated.
In other words,
annualized return = [ (1 + cumulative return)^ (1/n) ] - 1
Here are the annualized returns for these three inflation-adjusted returns calculated in Formula 3.
I1) Use cumulative return = 27.48% ; n = 4.24 => Annualized return = 5.9%
I2) Use cumulative return = 19.82% ; n = 4.24 => Annualized return = 4.36%
I3) Use cumulative return = 37.86% ; n = 4.24 => Annualized return = 7.87%
As you see, the value of n is same across all the three investments. Hence, you could have compared regardless. However, this formula 4 is very helpful in real life situations when different investments are held for different duration.
Final Answer to the two questions
Now, let us try answering the questions, adjusted for inflation using the annualized returns above.
Q1) Who did better ? The conclusion is still the same. Ms. US did better on her US investment (I3 = 7.87%) compared to Mr. Ind on his Indian investment (I1=5.9%).
By How much ? Now you can do the subtraction (7.87 - 5.9) = 1.97% annualized
Q2) Which investment was better for Ms. US ? Her US investment (I3=7.87%) did better than her Indian investment (I2=4.36%)
By How much ? (7.87 - 4.36) = 3.51% annualized
Bonus Insight:
Look at how the same Indian investment was better for Mr.Ind (I1 = 5.9%) than for Ms. US (I2=4.36%). This was because of the lower inflation rate that we used for Ms. US in the case of I2. In other words, the two siblings were better off investing in their respective markets. This is under the assumption that Mr.Ind didn't have access to US stock market.
1) Taxes - I have not discussed taxes on these investments to determine the post-tax return. Ideally, the inflation-adjusted rate should be calculated on the post-tax return. Depending on the duration you hold (Short-term vs. long-term capital gains), the kind of account you invest in (tax-deferred vs. not), the income tier one belongs to (the top marginal rate could be different by country) and country of origin (US tax on global income) - these returns are to be discounted with different tax rates.
2) Transaction costs - I have not accounted for transaction costs in trading these investments. I just used index as a broad metric. Similarly, if your investments are real assets, you must include all the transaction costs in buying, maintaining and selling the asset.
For instance, the currency conversion costs are not included in this analysis. There is some additional small leakage in this case as the rates that you would get from your banks are not the same as those used in the table above from fxtop site.
3) Risk-adjusted return - Not all investments are the same. Some are riskier bets than others. For an in-depth of treatment of the various risk ratios, WallstreetMojo has a good article.
If these investments were done on different dates and held for different duration, you wouldn't be concluding correctly. And, that is where the final formula comes into picture.
With an annualized return, you are comparing apples and oranges by bringing them under a common umbrella. The question that annualized return answers is : What is that "hypothetical annual rate of return" over "a same period" that would produce these respective cumulative returns for 3 different investments I1, I2 and I3 over "different periods" ? Here is another good article on this topic at the Motley Fool.
The math behind is:
(1+ annualized return) ^ n = 1 + Cumulative return
where n is number of years over which the cumulative return was calculated.
In other words,
annualized return = [ (1 + cumulative return)^ (1/n) ] - 1
Here are the annualized returns for these three inflation-adjusted returns calculated in Formula 3.
I1) Use cumulative return = 27.48% ; n = 4.24 => Annualized return = 5.9%
I2) Use cumulative return = 19.82% ; n = 4.24 => Annualized return = 4.36%
I3) Use cumulative return = 37.86% ; n = 4.24 => Annualized return = 7.87%
As you see, the value of n is same across all the three investments. Hence, you could have compared regardless. However, this formula 4 is very helpful in real life situations when different investments are held for different duration.
Final Answer to the two questions
Now, let us try answering the questions, adjusted for inflation using the annualized returns above.
Q1) Who did better ? The conclusion is still the same. Ms. US did better on her US investment (I3 = 7.87%) compared to Mr. Ind on his Indian investment (I1=5.9%).
By How much ? Now you can do the subtraction (7.87 - 5.9) = 1.97% annualized
Q2) Which investment was better for Ms. US ? Her US investment (I3=7.87%) did better than her Indian investment (I2=4.36%)
By How much ? (7.87 - 4.36) = 3.51% annualized
Bonus Insight:
Look at how the same Indian investment was better for Mr.Ind (I1 = 5.9%) than for Ms. US (I2=4.36%). This was because of the lower inflation rate that we used for Ms. US in the case of I2. In other words, the two siblings were better off investing in their respective markets. This is under the assumption that Mr.Ind didn't have access to US stock market.
Additional considerations :
Here are some additional considerations that we didn't get into.
2) Transaction costs - I have not accounted for transaction costs in trading these investments. I just used index as a broad metric. Similarly, if your investments are real assets, you must include all the transaction costs in buying, maintaining and selling the asset.
For instance, the currency conversion costs are not included in this analysis. There is some additional small leakage in this case as the rates that you would get from your banks are not the same as those used in the table above from fxtop site.
3) Risk-adjusted return - Not all investments are the same. Some are riskier bets than others. For an in-depth of treatment of the various risk ratios, WallstreetMojo has a good article.
4) Internal rate of return: Finally, all these three investments above are a simple transaction - with a single purchase and a single exit. So, it was easy to calculate the rate of return using Formula 1 for these investments.
In some cases, there are multiple and non-periodic cash flow situations, before the asset is finally disposed off. Using XIRR (Excel) for Formula 1 is topic for another day !
In some cases, there are multiple and non-periodic cash flow situations, before the asset is finally disposed off. Using XIRR (Excel) for Formula 1 is topic for another day !